5 Actionable Google Analytics Reports to Improve Your Marketing Today
This isn’t a 101-style post.
It’s assuming you’ve got the basics down.
You’ve got a simple analytics framework down. You’ve got Goals or Events set-up (properly).
But you want action.
You want to figure out how to move the needle in as short amount of time as possible.
Counterintuitively, you shouldn’t waste time with A/B testing. The good news, is that you also don’t need to start creating a bunch of new content or pages either.
Instead, you should be looking for the current changes that will yield the highest return. Lurking deep inside Google Analytics, you can uncover tremendous opportunities by simply optimizing or fixing what you’ve already got.
Best of all, you’re not guessing. You’re coming up with new ideas, implementing them, watching the results and iterating.
It’s informed. Predictable. And best of all, reliably successful.
With these 5 reports, you’ll be able to quickly draw actionable marketing ideas to improve your results.
This article was inspired by Andy Crestodina of Orbit Media’s excellent CTA conference speech.
1. Conversion Rates between Mobile & Desktop
Let’s get started with an easy one.
Considering that mobile internet users now outpace desktop, it’s fairly safe to assume that your mobile and tablet experiences need to be as good (if not better) than the one for desktop users.
However that’s a tricky proposition if there’s a multi-step checkout process users are forced to navigate with their thumbs. Or 5+ form fields that are cumbersome at best when you’re awkwardly typing out sentences with your fingers.
Getting clients to buy-in, or bosses to sign-off though is another matter.
Fortunately, there’s a simple report buried under the Audience section in Google Analytics that can quickly show how your mobile and tablet conversions measure-up compared with desktop.
The results can provide the ammunition you need for more funds and better resources.
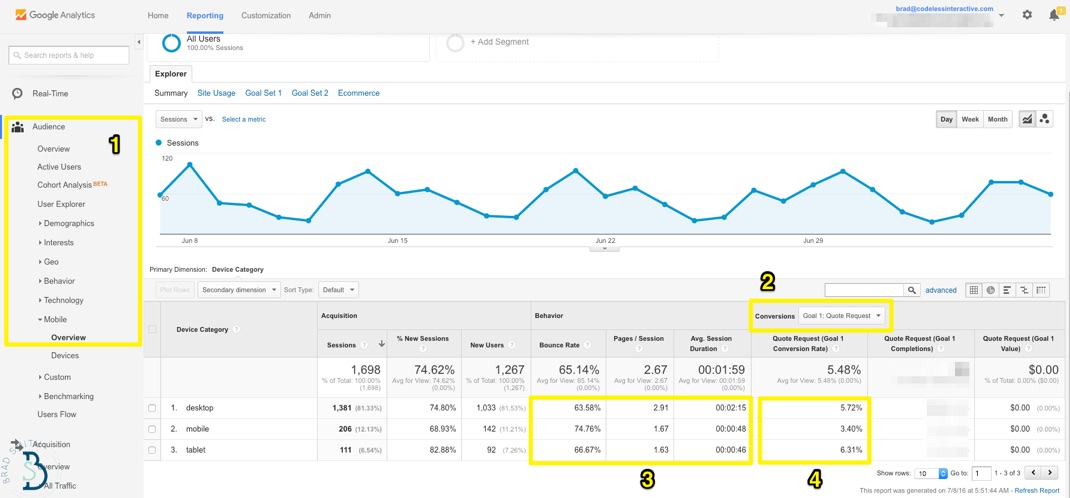
Step 1. After clicking on the Audience section, go all the way towards the bottom to find the Mobile > Overview.
Step 2. Now select your primary conversion goal under the appropriately named Conversions section.
Step 3. The first place to look for discrepancies between devices is in the engagement or Behavior section.
Conversions rarely happen after seeing only one page or being on the site for under a minute. So generally speaking, besides an obviously low bounce rate, you’d like to see higher Pages / Session and Average Session Duration.
Significantly lower numbers on mobile and tablet (vs. Desktop) is your first clue to a poor mobile experience.
The second, is the conversion rate number of each device. Again, higher is better generally. So a significantly lower conversion rate on mobile or tablet (compared with Desktop) should be a warning sign.
Bonus Tip: The best way to sell a fix or change is to calculate the cost of lost sales. Find the difference between sales or customer value of current Desktop and Mobile conversion amounts to provide a number of ‘lost sales’ that could be gained if you can make some improvements.
2. Identifying How to Improve Paths through Your Site
Most clients (and bosses) obsess over the homepage. They nitpick image selection, and shove as many things as possible into the tiny layout you provide.
Which makes sense, because it’s the focal point for how the rest of the site is going to look and function. It’s typically thought that it’s the starting point for the brand, where users begin their journey and find out where to go next.
However that’s not always the case.
If you’ve been creating content successfully on a regular basis, you’ll probably notice something strange when you view the most popular pages on your website…
The homepage will only account for roughly ~30% of incoming traffic. The rest? Your long-tail blog topics that are picking up more informational or educationaltopic queries.
What does that mean? The way visitors navigate through your site is probably pretty different than what you expect (or planned ahead for).
Here’s how.
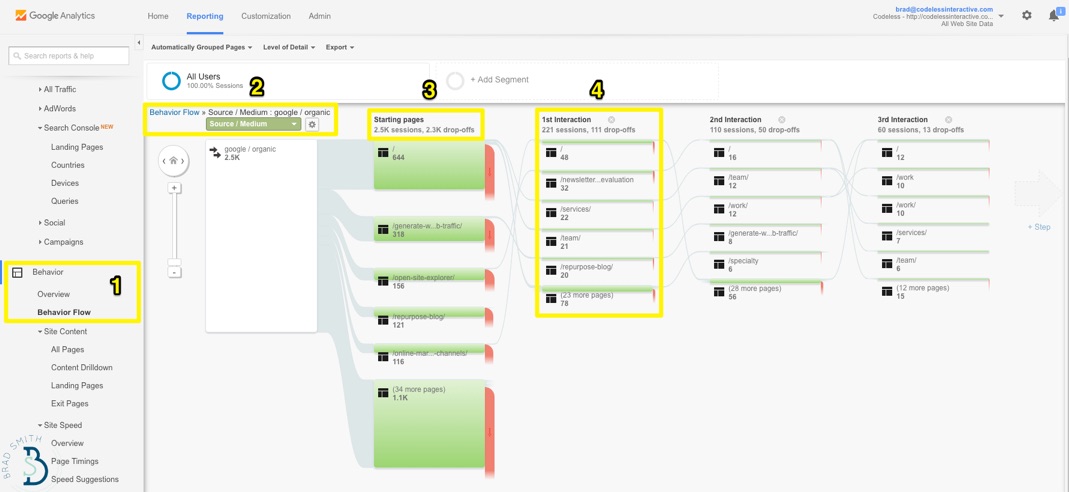
Step 1. Open up the Behavior Flow underneath the Behavior section.
Step 2. Now filter or segment your traffic based on the Source/Medium it’s coming through. Google/Organic will be your best bet for finding organic search visitors arriving at your site through content, SEO and other ‘inbound’ means.
Step 3. The first section here is your Starting pages, or landing pages / blog posts that people are coming to first from Google.
You’ll see in the example above that the homepage (denoted by the forward slash “/”) only accounts for a 20-30% of total visitors. The rest are going to other pages and blog posts first.
Step 4. The next interaction is where people are going after leaving the first page of your site.
Again, you’ll notice that people commonly go visit other web pages or blog posts (in addition to the homepage).
That means you have these intuitive paths’ that already exist on your website, where visitors are trying to navigate or find certain things that you didn’t necessarily plan out.
A quick win here includes helping people navigate (or see appropriate calls to action) more easily. Zero-in on the most common interactions or traffic flows, add new internal site links or ads to get people further down the funnel and into your macro (or micro) conversions.
3. ‘Low-Hanging Fruit’ Pages to Improve for Search
A few years ago, Google mysteriously stopped passing referral data to webmasters for “privacy” reasons (as if that exists on the internet).
While you could, conveniently, pay them in AdWords for this data (how nice), another way to get some quick SEO insights is to view the terms currently sending you traffic in the queries report (helpfully located under Acquisition > Search Console) sections.
The objective here though is to find all pages or terms currently ranking on the second page of Google (you know, the one nobody clicks on), improve those, and get them ranking on the first page (so they’re going to actually send you traffic).
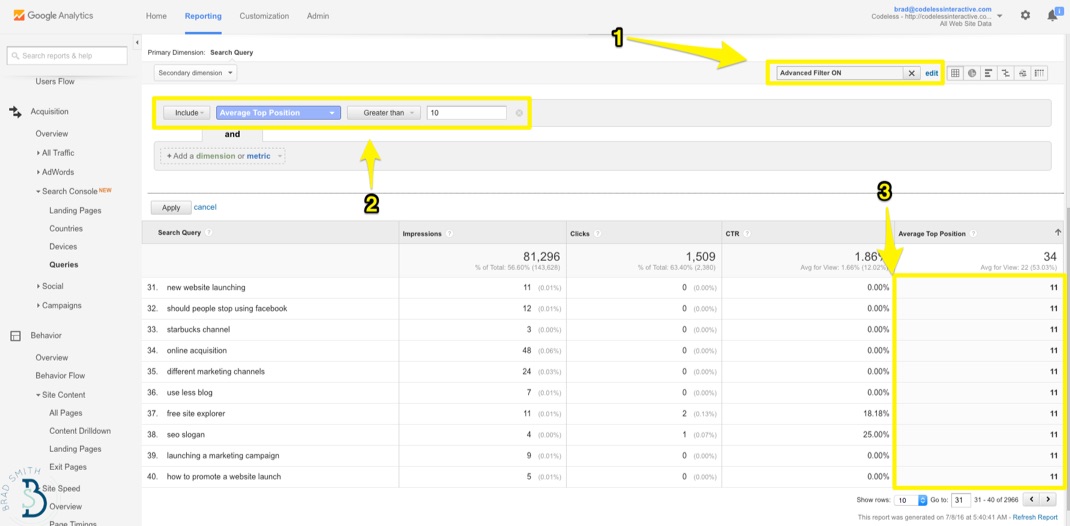
Step 1. Once you’ve located the Queries report, fire up an Advanced Filter. By default, Google often does a data dump into analytics, showing you tons of data at first glance and allowing you to dive deeper (if you know what you’re looking for).
These advanced filters (in addition to secondary dimensions) will help you narrow down the results into something a little more actionable.
Step 2. Now sort the data to display all results with an average position of OVER 10.
(There are 10 results on a search engine result page (SERP), which means the 11th position is the first result on the second page.)
Step 3. Pull down all the results currently ranking high on the second page. This is your ‘low-hanging fruit’ for quick content + SEO wins.
Now your job is to simply improve these pages! Maybe that’s the design aesthetic or adding some new production design to liven the page up. It could be adding content and additional context or information to make the page more in-depth. It could even be adding in new media types like videos to help explain or show what the page is talking about.
Find high potential yet underperforming pages, and improve those FIRST before going back to creating new content from scratch.
4. Top Search Pages Leaking Visitors
As we’ve seen so far, visitors don’t always do what we expect them to. And they don’t always find what they’re looking for.
That’s evidenced by high bounce rates, especially on important pages that are bringing in a ton of traffic to your site.
Finding those pages that (a) rank highly, (b) bring tons of traffic, but (c) fail to convert them could give you another quick boost of new leads or customers.

Step 1. Start by locating your most popular content under Behavior > Site Content > All Pages.
Step 2. Now we’re going to use another filtering or sorting tool to make this information more relevant. Click on Secondary Dimension, which we’ll use to again filter Source / Medium.
Step 3. Typically Google Analytics will automatically show the most popular pages. If that doesn’t happen, simply click on the Unique Pageviews to show the most popular first.
Now cross-reference these super-popular search pages (yay!), picking out the ones with super-high Bounce rates (boo!).
It’s common for blog posts to have bounce rates as high as 60-70%, however anything over that should be cause for concern. General website pages have lower bounce rate ranges of anywhere from 30-40%.
Much like the last tip, our goal here is to improve these pages! So many of the same tactics (e.g. adding new media types, improving design or internal linking, etc.) apply.
However you might also consider finding out WHY people are bouncing. Many times there’s a disconnect or mismatch with what people were expecting to see, and the information on the page that you’re delivering.
Try using some qualitative methods (like Qualaroo, live chat, or other survey pop-ups in your marketing stack) to get quick feedback on what people what to find when they hit this page.
5. Top Converting Content to Improve Internal Linking
Following the last few steps will help you identify the most popular way people are (a) arriving at your site and (b) navigating through it.
Executing those steps will help you capitalize on bringing in more site visitors while also shoring up holes or leaks causing people to leave too early because they’re frustrated or can’t find what they wanted.
The next logical step is to effectively funnel these people into your primary website goals or objectives to move your business metrics (like leads and customers).
Fortunately, there’s a simple report buried deep that can help you connect these dots.
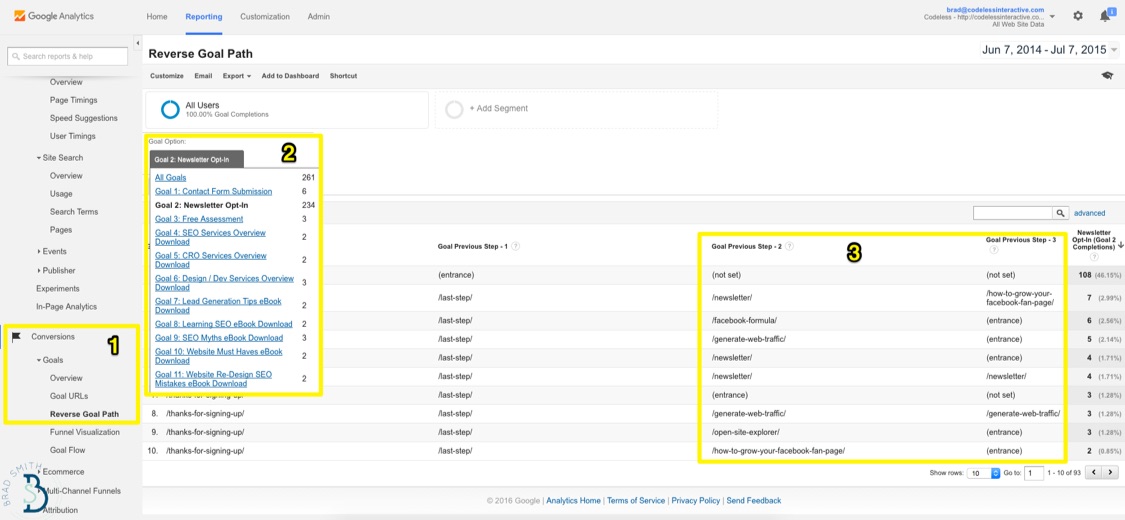
Step 1. Located the Reverse Goal Path under the Conversions section of Google Analytics.
Step 2. Select the primary Goal you’d like to view or analyze.
Step 3. Now you’ll be able to see the previous pages people used before accomplishing this Goal on your site. That means the page or two just PRIOR to converting.
These are your highest converting (or assisting) pages that you should funnel the rest of your visitors to from the other popular pages that you’ve discovered so far.
Easy. Peasy.
How to Connect the Dots: Combining Kissmetrics with Google Analytics
As we’ve seen so far, Google Analytics is great at telling you how and where visits might be coming from; that ‘top of the funnel’ information that’s useful in making tactical decisions about specific marketing channels.
However, it’s not so great at what comes next… tracking initial visits once they transform into bonafide leads, prospects, or customers.
Google Analytics only tracks the individual session (or visit) data, which also tends to skew conversion attribution (like showing the ‘last-touch’ people used prior to converting, overreporting some channels while underreporting others). All information from that visit is then discarded.
They have conversion funnels, but again they’re limited to both (a) only showing future data and (b) only tracking what happens on that single visit. Once the person leaves, their data does too.
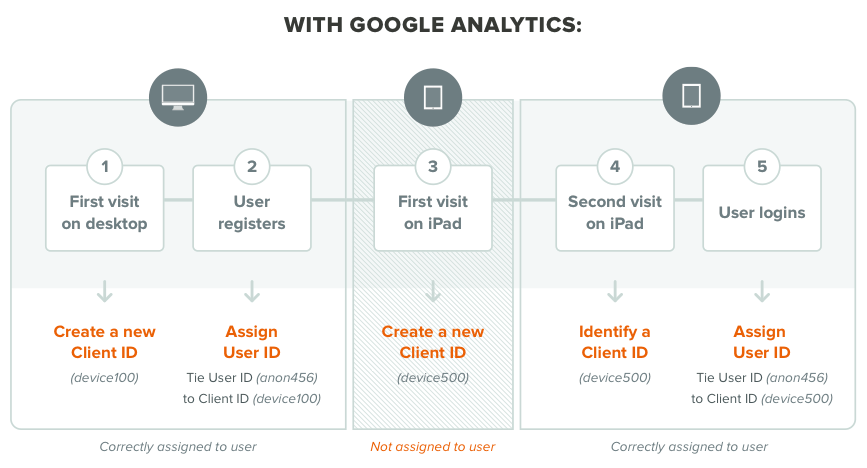
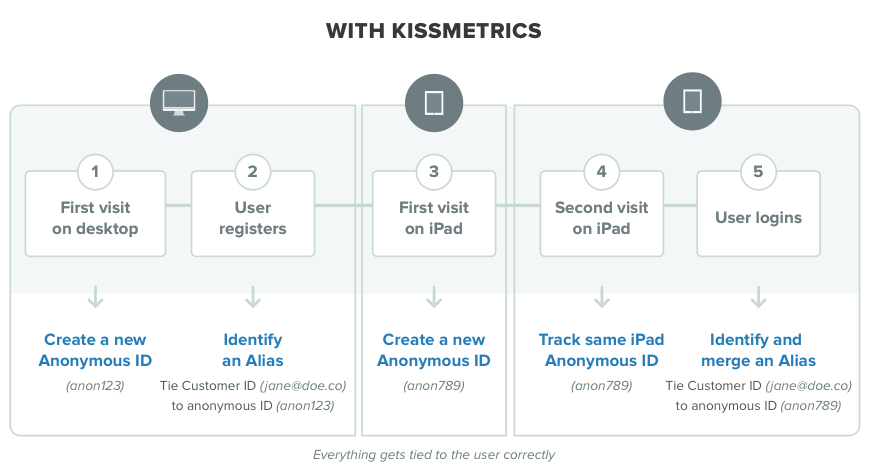
That’s why using it alongside a tool like Kissmetrics makes sense. They’re complementary, largely because of the difference in how they handle or track visitors.
Kissmetrics will treat visitors from the same device as the same visitor for example. It also saves all of that person’s previous session information (even if they didn’t convert) so that you’ll get a more nuanced view of what individual leads or customers actually did for the months, weeks or days leading up to a conversion.
That means your conversion data will not only be more accurate, but also more actionable as well. Below is one example of the funnel reporting showing steps to purchase.
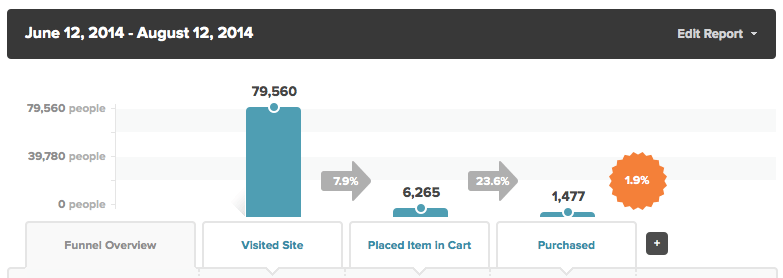
These additional features also enable you to run more sophisticated, granular analysis of individual cohorts.
Google Analytics is great for general information (like total numbers or averages of all session data). However it also lacks the nuance to sometimes dive deep. Using it alongside a more robust tool like Kissmetrics can help you gain back the ability to view individual customer interactions (both on your website and even inside an application) and analyze conversion data with greater insight (not to mention, accuracy).
Conclusion
Wanna double conversions in a few weeks?
Don’t worry about running A/B tests. And don’t waste time with new page or content creation.
First, go back and fix all the stuff that’s not working. The poor device experiences. The un-optimized (and unofficial) paths through your site. The high potential pages or posts hidden from the world on Google’s page two. And the popular pages that people are leaving immediately in droves.
Next, connect the dots by getting people from the most popular pages and paths to your pages that convert (or assist conversions) the highest.
Raw data, by itself, is meaningless. But using these five simple reports can help you layer in context and gain actionable insight that has the power to increase leads and sales literally overnight.
And best of all, it’s data-driven. So you can focus on what’s important (like successful implementation) instead of getting distracted by biases or HiPPO’salong the way.
About the Author: Brad Smith is the founder of Codeless, a B2B content creation company. Frequent contributor to Kissmetrics, Unbounce, WordStream, AdEspresso, Search Engine Journal, Autopilot, and more.