
Or they’ll gear everything toward that tentpole window and have limited budget left to reach consumers through the rest of the season.
How can you avoid these scenarios? How can you ensure that you’re going to be there at the right time for your holiday shoppers? The answer is forecasting.
Forecasting is key to understanding how to budget for the holidays properly. The fact is, your consumers are now shopping regularly throughout the season, and you need to know how and when to reach them. The good news is that forecasting is not as complex or intimidating as it seems. We’re here to offer guidance on why it's critical, and how to do it right:
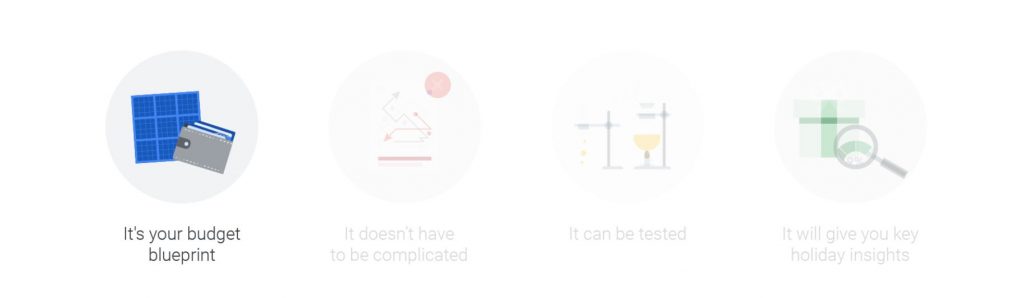
It’s your budget blueprint
If you are going into the holiday season without a sense of when customer demand is expected to go up or down, your budget may not be effective or reliable. With a solid forecast, you’ll be properly prepared for the biggest revenue-generating window of the year.
The great thing about forecasting is that it forces you to be customer-centric in your planning. What we are most interested in forecasting is demand — what your shoppers want, and when. The more we put our customers at the centre of what we do, the more effective we are as marketers and the more helpful our work will be to the end user.

It doesn’t have to be complicated
Forecasting can involve complex stats, especially when you want to account for uncertainty. The fundamentals, though, are easy to grasp.
The best way to demonstrate this is to walk through a basic example. Let’s create a simple forecasting model for clicks on Google paid media this coming holiday season. Here’s how you can start to form expectations around what your holiday clicks are going to look like:
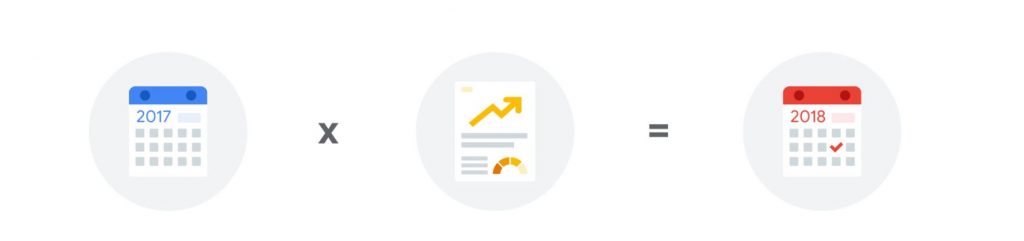
- Start with historical data. The Black Friday-Cyber Monday period of 2017 offers vital information to predict the clicks that Black Friday-Cyber Monday 2018 will generate. Remember: a forecast that uses historical data will only be as good as the historical data it uses, so be wary of basing your forecast on data that you know is inaccurate or contains anomalies you won’t expect to see again.
Pro tip: We recommend, in general, building a forecast around a sizeable peer set, whole industry or vertical rather than basing it on your own data alone. - Determine your expected growth rate. This year won’t be a carbon copy of the last, so you’ll want to include some information about how you expect your demand to change this year. You can use the information we already have for 2018 to date — with more than half of the year behind us already, we can see how much the weekly growth rate has changed over that time period in 2017. More advanced approaches will model this as something called “drift,” and may average change over several years instead of just one.
- Find your estimate. Apply your growth rate to the historical data you’ve gathered, and the result will be your estimated 2018 holiday clicks. Now you have an accurate forecast. To get started on this process, you can turn to your Google Ads data and the insights featured on Google Trends.
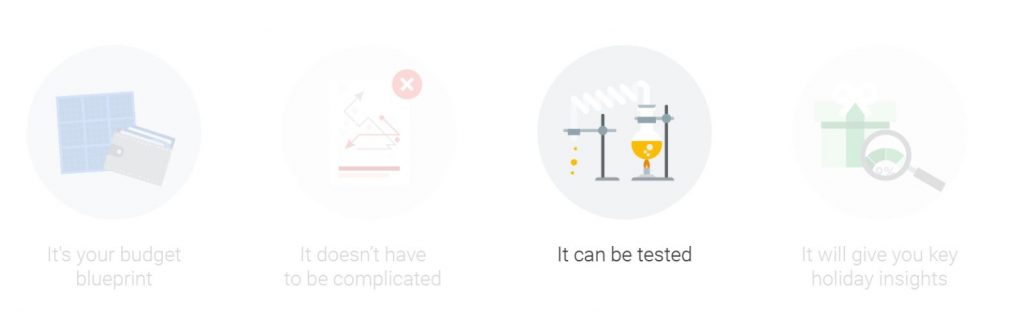
It can be tested
How do we know our model makes sense? Use it to see whether it does a good job predicting previous years. Here’s an example of how this might look for the apparel category:
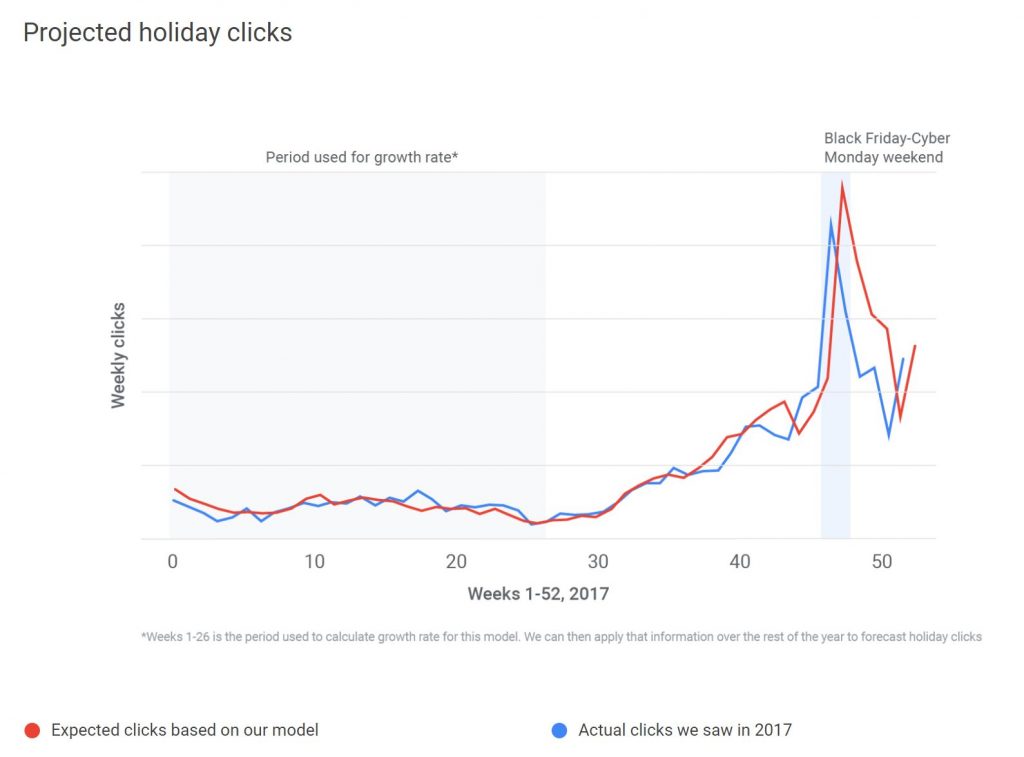
When you compare the two lines, you’ll see that predicted vs. actual holiday clicks aren’t far off from each other. This helpful check ensures that your assumptions make sense and that you can start making some decisions around them.
It will give you key holiday insights
If you apply this model week to week during the holiday period, you can determine when demand will be highest.
Here is how that might look in the apparel category.
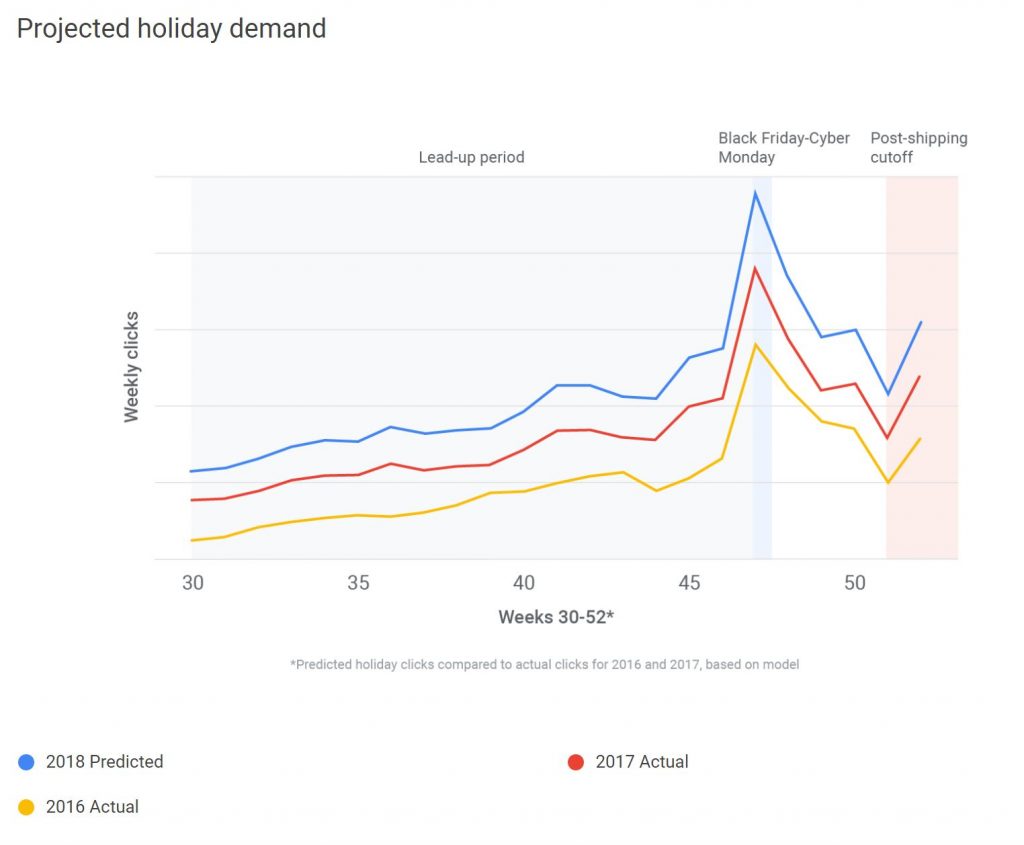
We see a huge spike in clicks over the Black Friday-Cyber Monday period (week 47). That’s not a big surprise, but a forecast helps you prepare for just how high engagement over that time period will be.
You’ll also see that there’s a steady ramp up of engagement from week 30 through Black Friday-Cyber Monday. Interest is peaking, and clicks are rising. And toward the final weeks of the year — after the usual shipping cutoff — traffic is still high relative to non-holiday periods.
So, while you may be inclined to prioritize tentpole events like Black Friday-Cyber Monday, it’s important to look at consumer activity in the weeks around it as well. Forecasting helps ensure that you don’t miss those consumers. If you can get into the habit of forecasting every year, your marketing campaigns will become more effective and more helpful to your customers.