What Are Social Media Analytics and Why Do They Matter?
Social media isn’t just about pretty pictures and catchy captions—it’s a powerful tool that can either boost your business to new heights or leave you shouting into the void. But how do you know if your posts are actually making an impact? Enter social media analytics: the key to transforming guesswork into a winning strategy.
Social media analytics refer to the data and insights gathered from your social media activity. These metrics go beyond simple likes or followers; they provide a window into how your audience interacts with your content, how effectively your campaigns are reaching your target audience, and what impact they’re having on your business or campaign goals. For small businesses, understanding these analytics is crucial for crafting social media marketing campaigns that are both cost-effective and impactful. By using data to guide your strategy, you can stop guessing and start making informed decisions that drive results.
A Breakdown of Key Performance Indicators (KPIs)
Key Performance Indicators, or KPIs, are measurable values that indicate how effectively a person, team, or business is achieving specific objectives. In the context of social media analytics, KPIs are the metrics you track to determine the success of your campaigns or social content.
Think of KPIs as a scorecard of your social media performance. They help you focus on what matters most by giving you clear benchmarks to work towards. When selecting KPIs, it's important to choose ones that align with your business goals. For a small business, common social media KPIs might include:
- Impressions: The total number of times your content is shown, even if it’s to the same person multiple times. Useful for understanding visibility.
- Reach: The number of unique users who see your content. This tells you how far your message is spreading.
- Engagement: Measures interactions (likes, comments, shares) on your content, showing how actively your audience is involved.
- Engagement Rate: Measures how often people interact with your content (likes, comments, shares). A higher engagement rate indicates resonant content.
- Click-Through Rate (CTR): The percentage of people who click a link in your post. A higher CTR shows effective call-to-action and relevance.
- Profile Visits: Counts how many times people view your profile, reflecting interest in your brand or content.
- Follower Growth: Tracks the increase or decrease in your social media followers over time, indicating audience growth.
- Conversion Rate: Tracks the percentage of users who take a desired action after interacting with your content, like signing up for a newsletter or making a purchase.
Interpreting your social media analytics is essential for transforming data into actionable business strategies. By closely monitoring Key Performance Indicators (KPIs), you can assess whether your efforts align with your objectives, such as enhancing brand visibility, driving website traffic, or increasing sales. For example, if your goal is to increase engagement, a relevant KPI to monitor would be your Engagement Rate. If you're aiming for more website visits, you’d track your Click-Through Rate (CTR). Without clear KPIs, it's easy to lose focus and allocate resources to strategies that don't yield results.
Now I can hear you asking through the screen, “What is a good engagement or conversion rate?” While it's tempting to seek specific numbers, what's considered “good” varies significantly based on your industry, business goals, audience size, and previous social performance.
For instance, according to recent industry benchmarks, the average engagement rate across all industries is approximately 5.0% on Instagram and 3.0% on Facebook. These figures provide a general idea but should not be the sole determinants of your success.
It's crucial to establish KPIs that reflect your unique business context. Consider your audience size, as smaller audiences may yield higher engagement rates due to a more targeted following, while larger audiences might result in lower rates but higher overall engagement numbers. Analyze your historical performance as well, using past data as a benchmark to set realistic and attainable goals, focusing on continuous improvement rather than industry averages.
By understanding and monitoring the right KPIs tailored to your business, you can make informed decisions, optimize your strategies, and drive future success.
Leveraging Meta Business Suite for Actionable Insights
Meta Business Suite stands out as a FREE all-in-one solution, simplifying the process of managing and analyzing both Facebook and Instagram accounts. It offers small businesses a user-friendly way to track performance, understand their audience, and refine their strategies—all without needing advanced technical skills.
With features like audience insights, content performance tracking, and a user-friendly dashboard, you can easily monitor engagement, reach, and demographics. The platform helps identify trends, measure success, and set benchmarks for improvement, all in one integrated space.
Want to learn more? Visit these links to get started:
With Meta Business Suite, you can visualize your performance at a glance and identify opportunities for growth. These steps not only simplify the process of gathering insights but also build confidence in interpreting data and applying it to optimize campaigns.
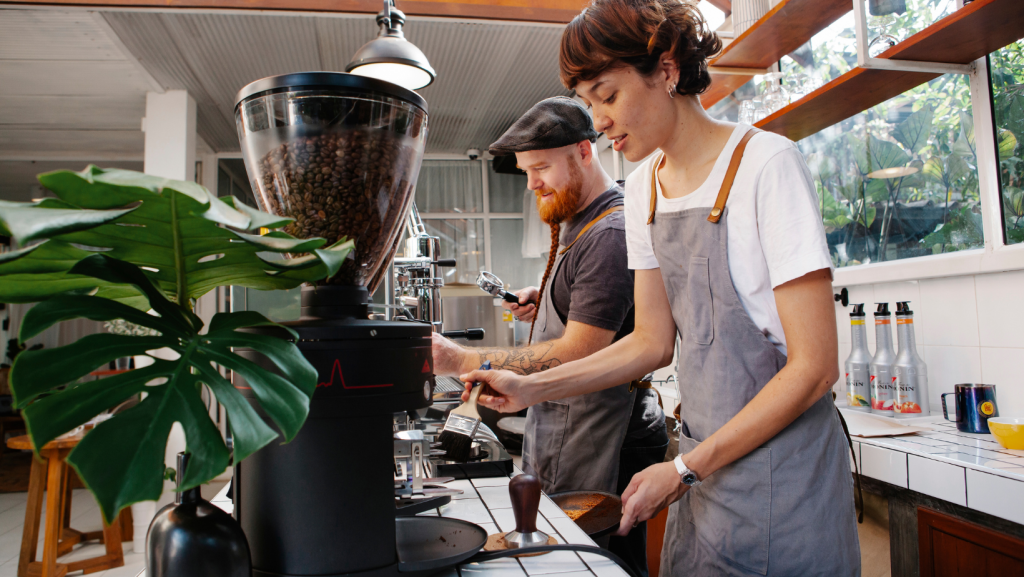
Mini Case Study: Bloom & Brew
Background Bloom & Brew is a cozy coffee shop that also sells houseplants and plant care accessories. Recently, the team noticed a growing trend among their customers: a shared love for coffee rituals and buying new greenery. Inspired by this insight, they decided to launch a campaign that combines the two passions into one irresistible offer. Campaign Goals
Key KPIs Tracked
Results
Takeaway for Business Owners Bloom & Brew used analytics to transform their social media strategy. Initially, their Instagram posts had low engagement despite a visually appealing feed. Using Instagram Insights, they discovered their audience loved posts featuring behind-the-scenes videos of creating the bundles, or how they decided which coffee goes with each plant. By doubling down on these types of content and posting during peak audience activity times, they increased their overall engagement rate by 20% during the campaign. Additionally, with the help of Meta Business Suite, they identified that the posts that contained mass amounts of text such as those that described what was in their coffees were underperforming, which led to not achieving their desired follower growth. Knowing this will allow them to re-evaluate and switch up their content for their next campaign. This example illustrates how small businesses can use analytics to refine their approach and achieve measurable success. |
Conclusion
For small businesses, understanding your analytics is like having a map to guide your social media journey. It’s about spotting patterns and trends that reveal what resonates with your audience and what might need a little tweaking. By interpreting these insights, you can refine your strategy and make informed decisions that drive results.
Here’s how to make the most of your data:
- Spot Trends: Identify high-engagement content to replicate and low-performing posts to tweak or improve.
- Know Your Audience: Use demographic data to ensure your content resonates with your target market. Adjust targeting as needed.
- Be Consistent: Regularly post audience-preferred content at optimal times to stay top of mind. Tools like Meta Business Suite can help.
- Take Action: Focus on top-performing formats (videos, images, etc.), schedule posts during peak activity, and tailor ads to audience interests.
- Adapt & Evolve: Low engagement? Test new ideas, tones, or formats. Missed goals? Reevaluate your strategy and adjust.
Social media analytics may seem daunting at first, but they’re an essential tool for any small business looking to grow online. By understanding key metrics, using the right tools, and turning insights into action, you can create campaigns that resonate with your audience and drive real results. Start small, stay consistent, and let the data guide your way to success.
Your Turn
Set clear goals, track the right metrics, and adjust your strategy based on what works. Start small, analyze your results, and watch your business grow! To see how this business example built their campaign, join us for our Launch a Successful Social Media Campaign webinar on January 23rd, 2025!